
ToDiagram | Data to diagrams in seconds
Visit SiteVisualizing Data in Seconds: ToDiagram Review
ToDiagram is an innovative online tool that transforms raw data into interactive diagrams, empowering users to visualize their data and gain valuable insights. This Chrome extension is designed for various audiences, including developers, data engineers, scientists, analysts, product managers, designers, SEO specialists, and more.
Key Features
ToDiagram boasts several key features that make it an indispensable tool for anyone working with data:
- AI-Powered: The platform utilizes AI to filter, restructure, or translate fields, making data analysis more efficient.
- Cloud Storage: Users can save their data in the cloud, access it from anywhere, and share it with other users.
- Comparison Tool: ToDiagram allows for easy comparison of two datasets, highlighting differences between them.
- Node Inspection: The platform provides an intuitive interface to navigate through arrays and objects, preview images, and view JSON Path.
Benefits
By using ToDiagram, users can:
- Enhance Data Understanding: Visualize data structures, trends, and patterns to gain a deeper understanding of their data.
- Improve Collaboration: Streamline collaboration with development teams by visually exploring and modifying design tokens.
- Accelerate Decision-Making: Support strategic decision-making by transforming raw data into meaningful visualizations.
- Boost Productivity: Work with data efficiently, reducing the time spent on manual data analysis.
User-Friendly Interface
ToDiagram's user-friendly interface makes it easy to navigate and use, even for those without extensive technical expertise. The platform offers a range of features that cater to different user needs, including:
- Chrome Extension: A convenient extension that allows users to open web pages directly on ToDiagram with a single click.
- Sign-up Process: A straightforward sign-up process that gets users started quickly.
Conclusion
ToDiagram is an innovative tool that simplifies data analysis and visualization, empowering users to gain valuable insights from their data. With its AI-powered features, cloud storage, comparison tool, node inspection, and user-friendly interface, ToDiagram is an essential tool for anyone working with data. Try it out today and experience the benefits of visualizing your data in seconds!
Related Tools

DaaiC | Data Analytics & AI Conferences
Discover and track data analytics and AI conferences worldwide. Find upcoming events, get reminders, and stay connected with the data science communit...
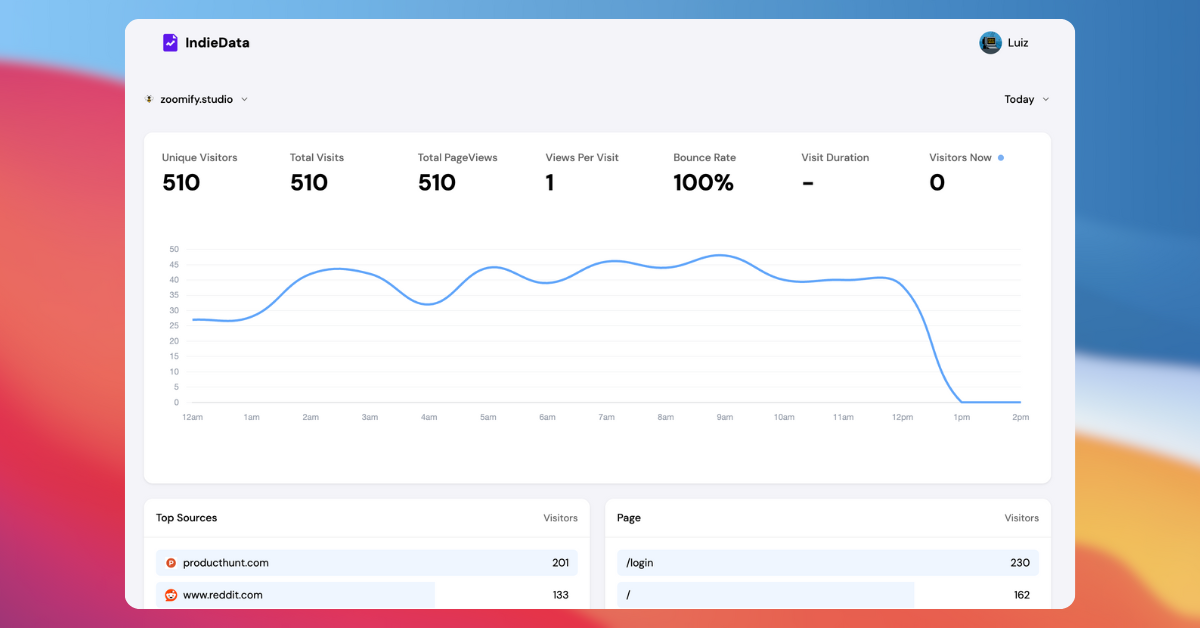
IndieData | Privacy-First Analytics You Control
Own your website analytics data. Privacy-friendly, decentralized tracking with no recurring fees.
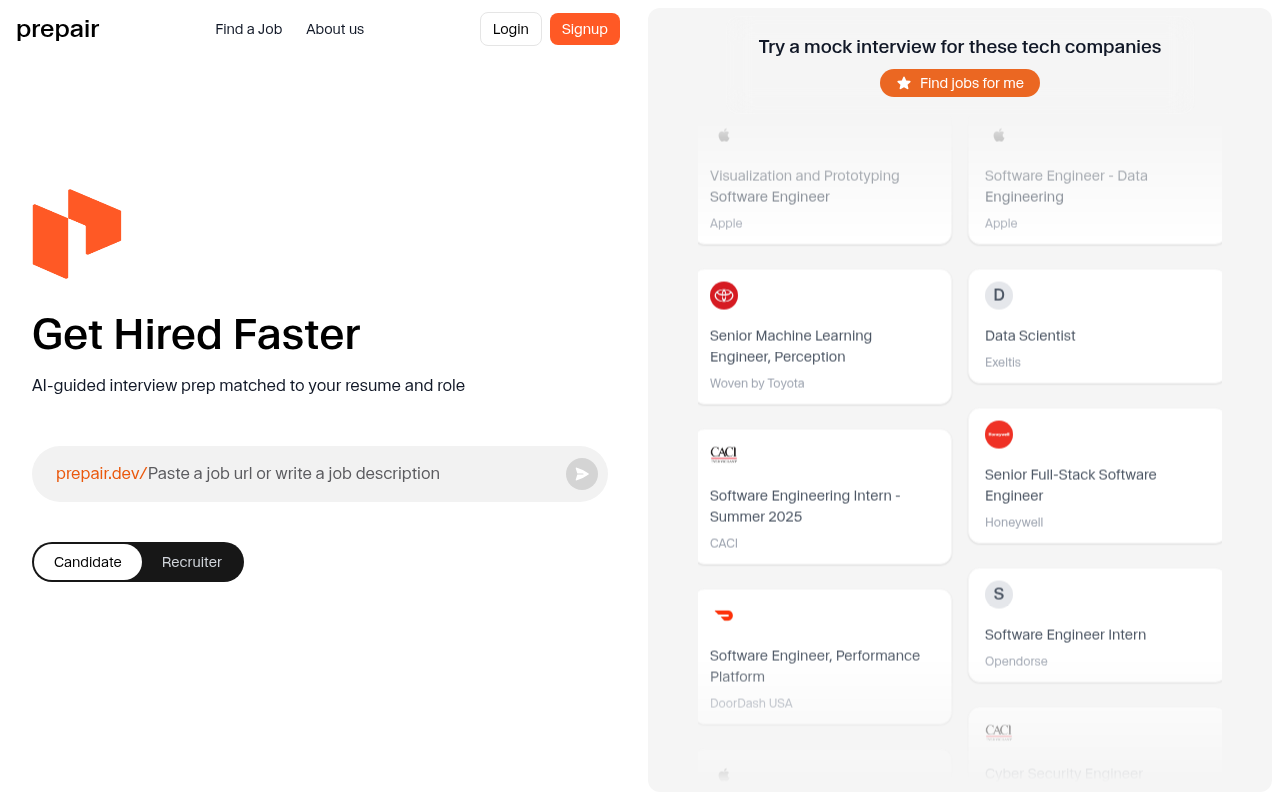
Prepair - AI-Powered Interview Practice & Recruitment Platform
Practice interviews with AI, match your resume to jobs, and streamline recruitment with automated candidate screening.