Histogram Maker
Visit SiteHistogram Maker: A Powerful Tool for Data Visualization
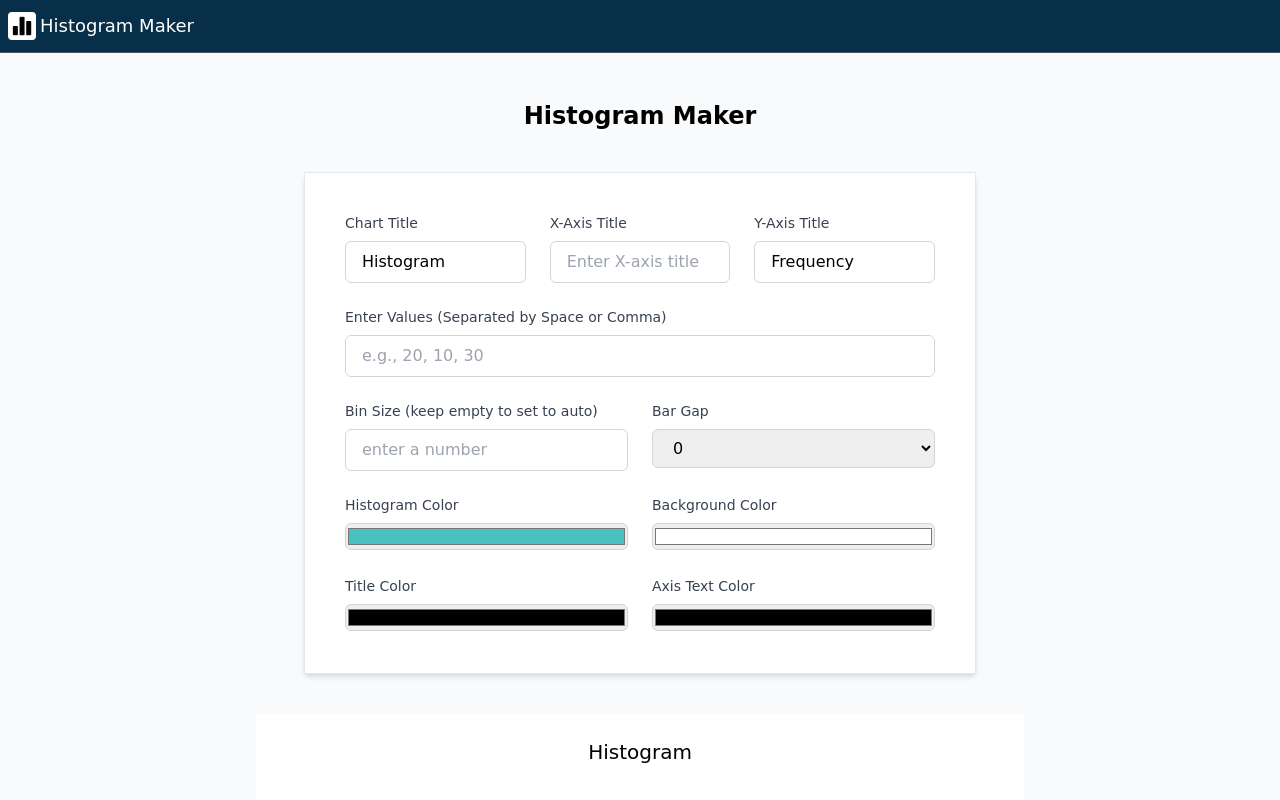
The Histogram Maker website is an online platform designed to help users create and analyze histograms with ease. With its user-friendly interface, the website offers a range of features that make it an essential tool for anyone looking to visualize their data.
Key Features
The Histogram Maker website boasts several key features that set it apart from other data visualization tools:
- Easy Data Input: Users can upload their dataset or enter it manually, with support for CSV and Excel formats.
- Automatic Bin Sizing: The tool automatically calculates the optimal bin size for clear visualizations or allows users to set custom intervals.
- Interactive Visuals: Users can adjust colors, labels, and graph styles to make their histogram stand out.
- Instant Graph Generation: Histograms are created in seconds without complex software.
- Download Options: Users can export their histogram as an image (PNG, JPG) or SVG for reports and presentations.
- Customizable Axes: Users can add titles, adjust ranges, and label axes for better clarity.
- Responsive Design: The website works seamlessly on both desktop and mobile devices.
What is a Histogram?
A histogram is a graphical representation that displays the distribution of numerical data. It uses bars to show how data points are grouped into ranges (bins), with the height of each bar representing the frequency of data points in that range. Histograms are particularly useful for visualizing patterns in data, revealing trends and identifying outliers or gaps.
Benefits
The Histogram Maker website offers several benefits to users:
- Easy Data Analysis: The tool simplifies large datasets into an easy-to-understand format.
- Quick Results: Instant graph generation saves time and effort.
- Customization Options: Users can personalize their histograms with colors, labels, and graph styles.
- Versatility: Histograms are widely used in fields like statistics, research, and business.
Overall, the Histogram Maker website is an essential tool for anyone looking to visualize their data. Its user-friendly interface, range of features, and benefits make it a valuable resource for data analysis, decision-making, and presentation purposes.
Related Tools

First Book ai Transform Your Ideas into Published Books with AI
Unlock the power of AI with First Book ai and streamline your book writing journey. From initial outline to final draft, our platform guides aspiring...
hootz AI companion for focused productivity
Unlock your potential, eliminate distractions, and achieve more every day

BlockScroll: No Short Videos - Apps on Google Play
Block Shorts & Reels to reclaim your time and enhance your productivity!